

Reports
For managers and admins
Reports is the organisation-wide view of logged time — every member’s entries, for a period you choose. Use it to find what your team has logged for a repository or a client, and to export those figures as a CSV file. This page is for managers and admins; members do not see Reports.
Reports does not change any time by itself. To send a document to a client, generate a timesheet instead: Create timesheet in the page header takes you to the Timesheets page — see Generate a timesheet.
Choose a period
Section titled “Choose a period”The default range is the last 14 days. Use the segmented control at the top of the page to switch to 7d, 14d or 30d, or choose Custom and set a From and To date (type a date or pick one from the calendar; neither can be in the future). If To is before From, the page says To must be on or after From. The chosen period is written into the page’s address, so you can bookmark or share a filtered view.
On the Free plan, the window reaches back only to the start of the last 60 days. A preset that would go further back is cut to that date, the page says from that date beside the period, and the date picker stops there. See Plan limits when you log time.
Filter the report
Section titled “Filter the report”Each filter is a pill that opens a list of options. Once you pick a value, the pill shows it and gains its own × button, which clears that filter; select the pill again to choose a different value.
| Filter | What it does |
|---|---|
| Any repository | Limit the report to one repository from your organisation’s allowlist. |
| All users | Limit the report to one member. This filter is shown to admins only. |
| Any activity | Limit the report to one activity type (for example Development or Meetings). Archived types are listed separately at the end, so you can still report on them. |
| Any billable status | Choose Billable or Non-billable. |
| Any client | Limit the report to the repositories tagged to one client. Shown to managers and admins. |
The client list is maintained by an admin — see Clients.
Read the summary
Section titled “Read the summary”Admins see a warning above the summary when anyone in the report has an empty weekday in the range. It is one line of counts, for example Possible missing time: 5 people, 31 person-days with nothing logged. You can still export it. It is a nudge, not a block. To see who has the gaps and on which days, open the Team page for the same period.
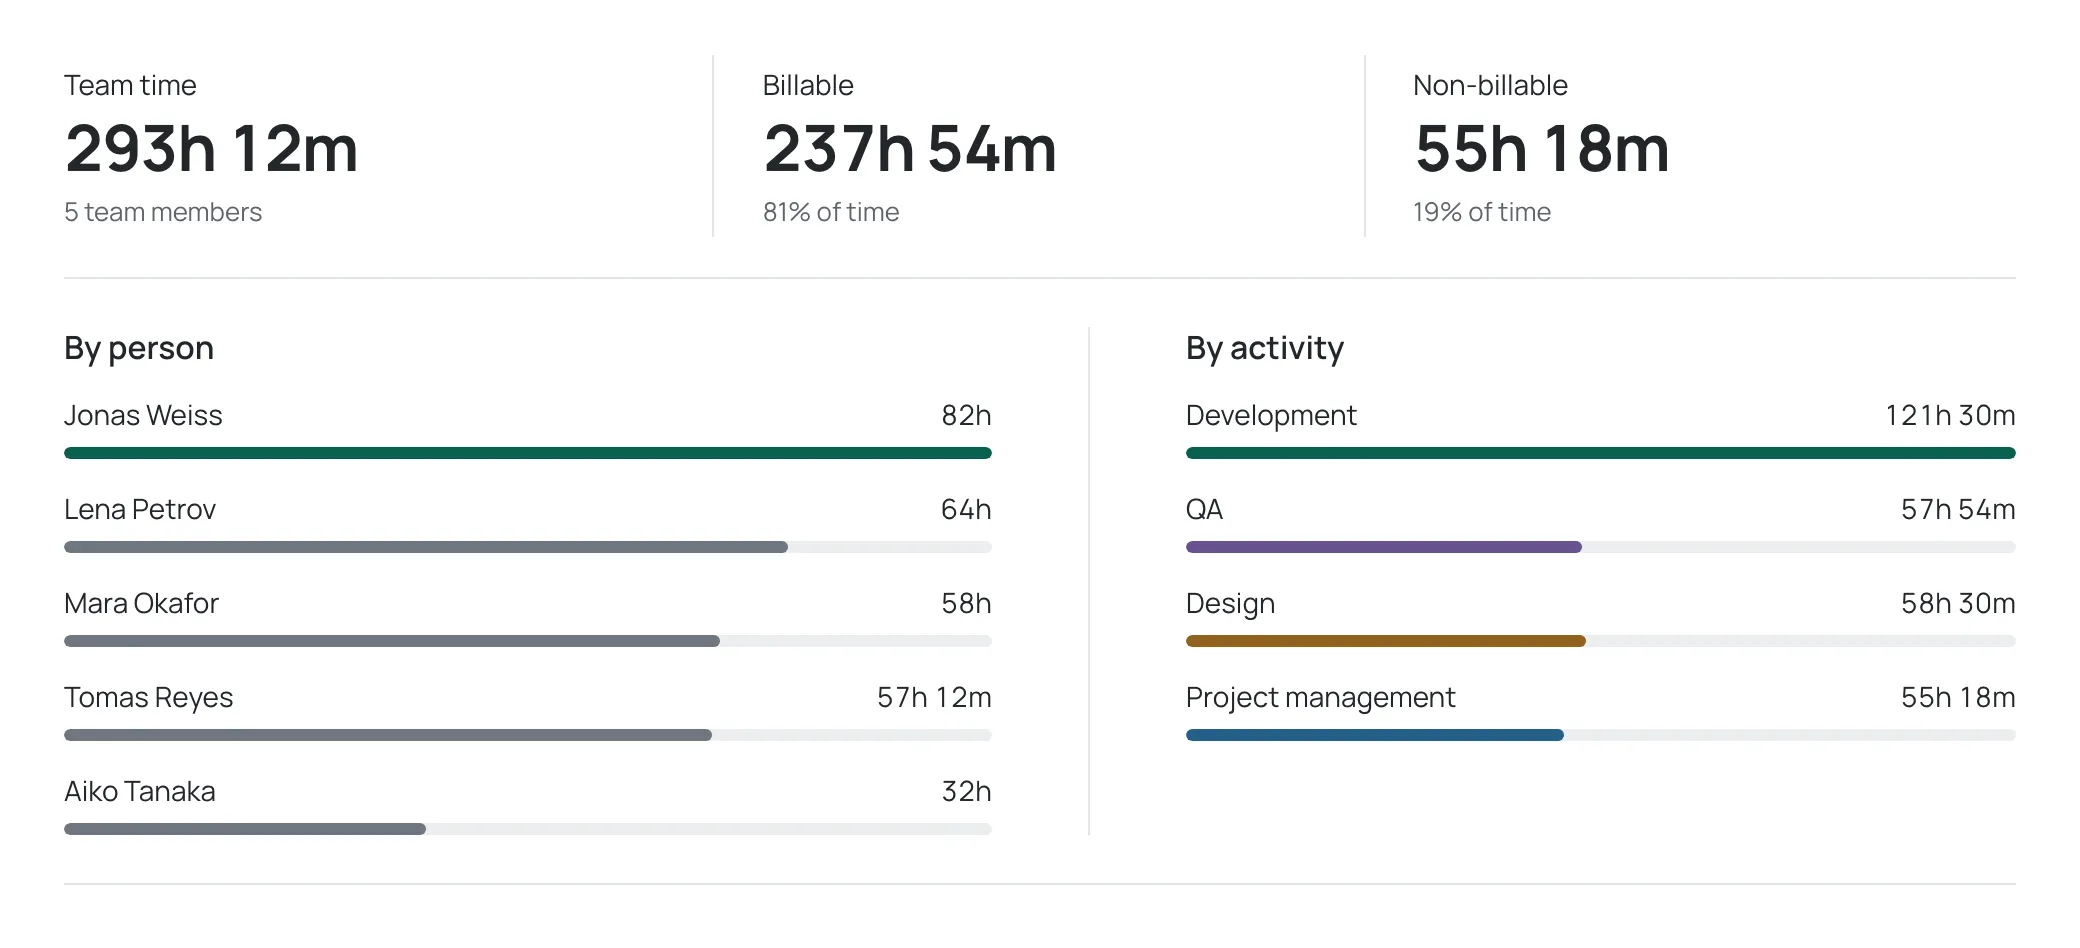
Three totals run across the top, for the current filters:
- Team time — all logged time, with the number of team members it covers.
- Billable — the billable total and its share of the logged time.
- Non-billable — the non-billable total and its share.
Below them, two lists break the time down:
- By person — the total per member, each with their name, hours and a bar. The member with the most time is highlighted.
- By activity — the total per activity type, in the order your admins set in Activity types. Each bar uses the activity’s colour.
Read the Hours by day grid
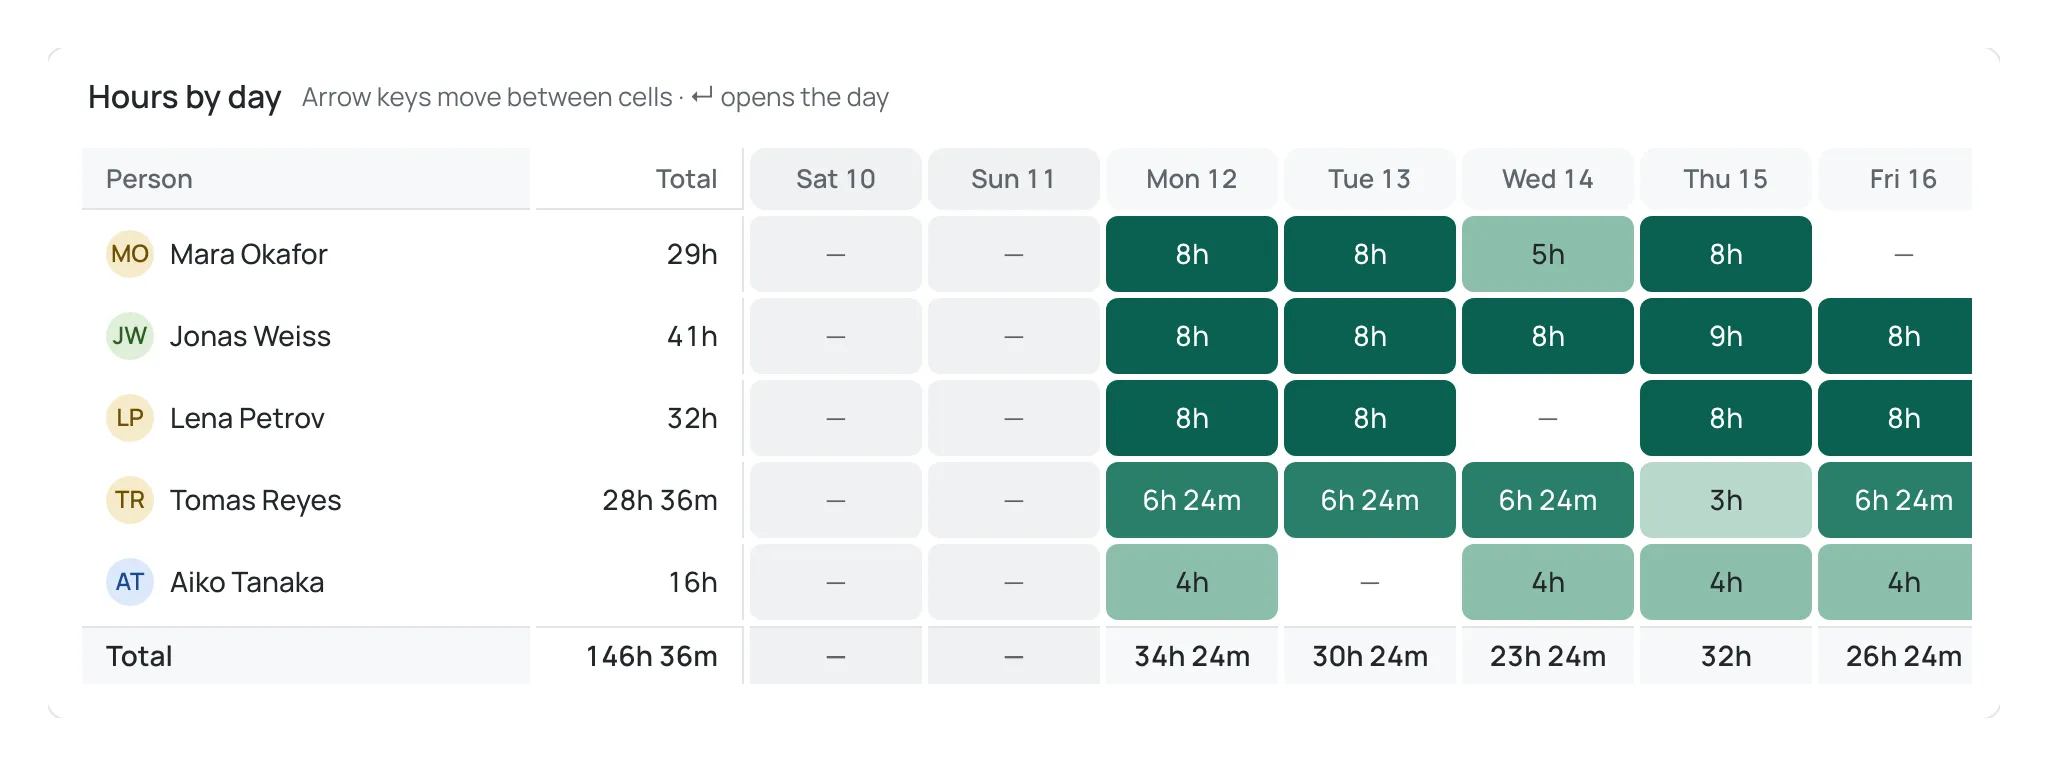
Section titled “Read the Hours by day grid”The Hours by day grid has one row per person and one column per day in the period:
- Person and Total come first and stay in place, so a person’s total stays visible as you scroll sideways.
- Each day cell is tinted more strongly the more time was logged that day. A day with no time shows an em dash (
—). - The bottom row shows the total logged by everyone on each day, and the overall total.
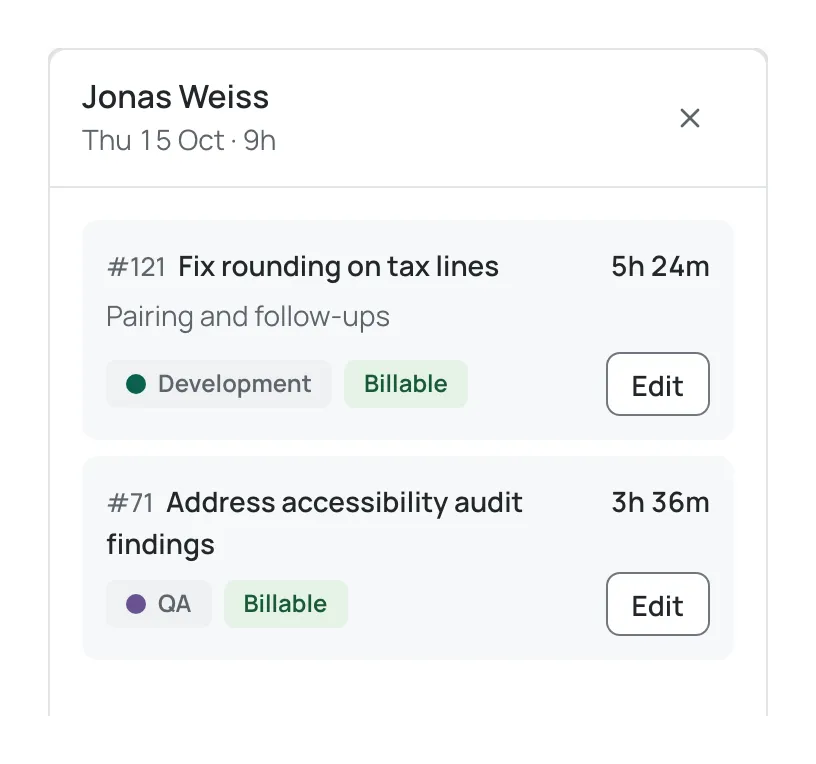
Select a day cell to open a panel at the side of the page listing the entries behind that number. Each entry shows its issue, duration, description, activity and whether it is billable; an issue that has been deleted on GitHub is flagged. From a listed entry you can edit it when you are allowed to — see Edit another member’s entries. A cell with no time opens the panel too, and says No time logged. Select the same cell again, the panel’s close button, or press Esc to close it.
On a keyboard, Tab into the grid and use the arrow keys to move between day cells, Home and End to jump to the ends of a row, and Enter to open the panel for the selected day. See Keyboard shortcuts.
If nothing matches your filters, the grid shows No entries match the filters.
Export
Section titled “Export”Open the Export menu in the page header (hover over it or select it) to choose a download:
- Download CSV — the hours grid as a comma-separated file, one row per person and one column per day. The download uses exact decimal figures (for example
2.50h) even though on screen the same value reads as2h 30m. - Time entries — every line for one repository in the period, with its work date, user, issue, title, activity, billable flag, duration and description. It includes billable lines only, which is what you would send to a client. It is available only when the Any repository filter is set to one repository; the menu item then reads All time entries for that repository.
The activity column
Section titled “The activity column”In the Time entries export, and in a timesheet’s Download CSV, the activity column is called activity and holds the activity type’s label, for example Development, not its key.
- In the Time entries export, the label is the type’s current label.
- A submitted timesheet (and one that was later approved, rejected or voided) keeps the labels its types had when it was submitted, even if an admin renames a type later. A draft timesheet uses the current labels.
- A timesheet submitted before activity types could be renamed keeps its original format: the column is called
activity_typeand holds the key, for exampledev. These documents are never changed.
If you import ChronoTab CSV files into a spreadsheet or another tool, update anything that looks for the activity_type column.
Reports no longer has an Invoice section or a Check for deleted issues action. To check your own entries for deleted issues, use Check for deleted issues on My week; the drill-down panel still flags lines whose issue was found to be deleted.
Ad-hoc Reports show the exact total. Rounding applies only when a timesheet is generated — see Duration and date rules.
Next steps
Section titled “Next steps”- Create a timesheet for a period you are ready to send.
Need help? Email support@chronotab.com.